How to Measure Client Completion Rate
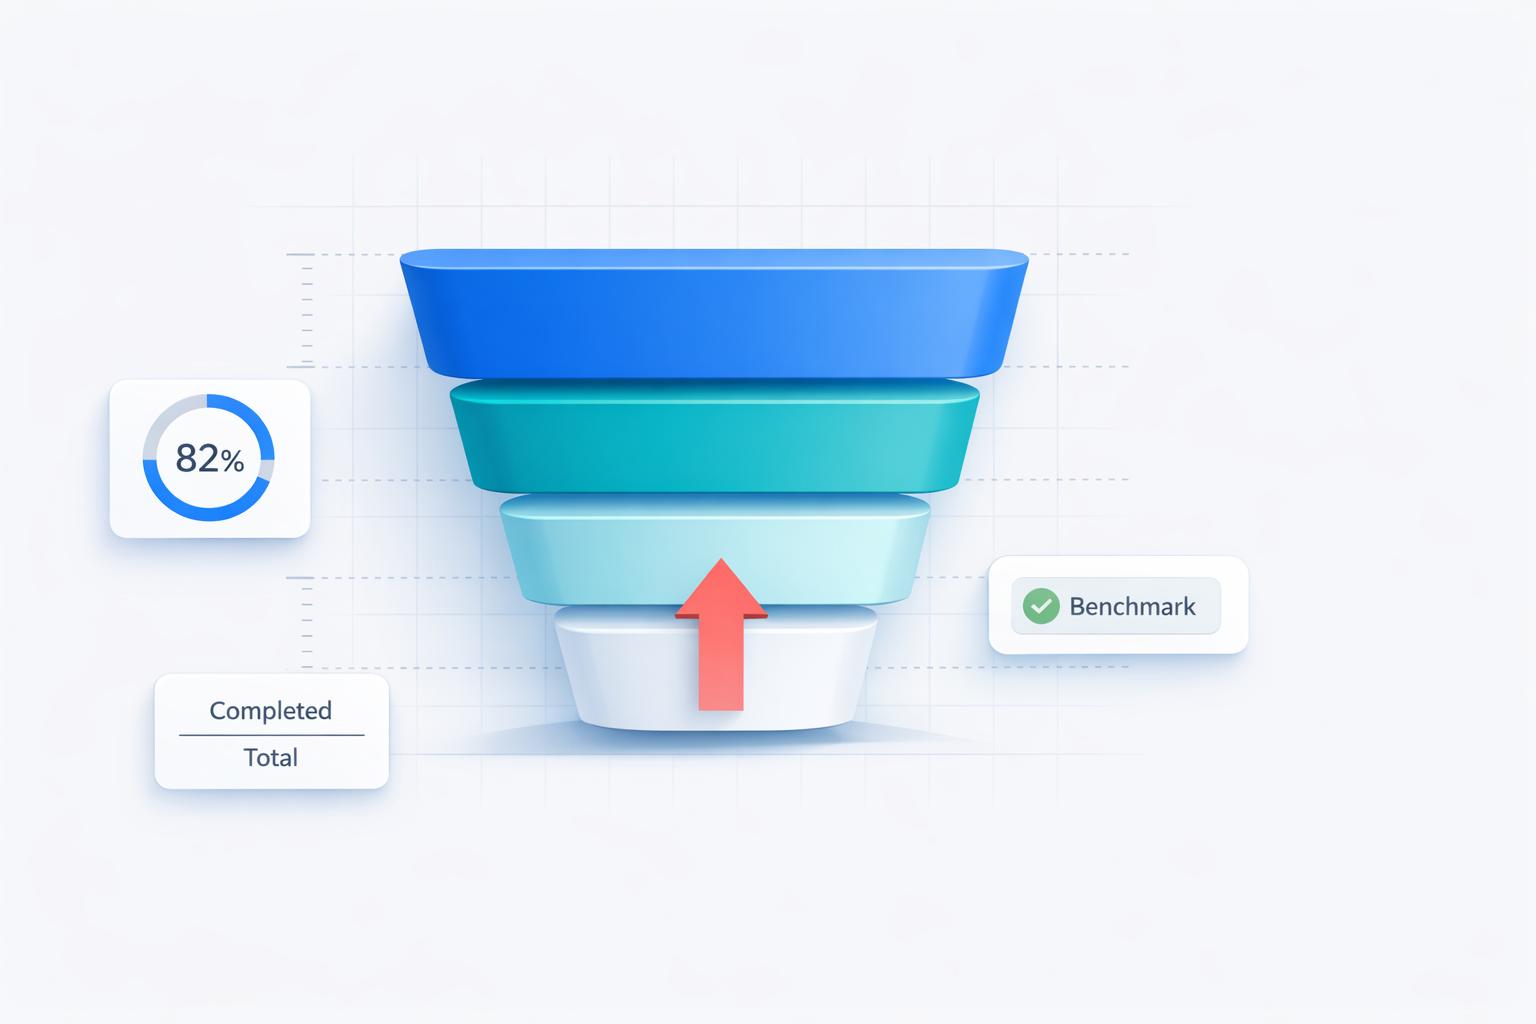
Client completion rate measures how often clients finish tasks, feedback requests, or onboarding steps within a set timeframe. It’s a simple formula:
(Completed Tasks ÷ Assigned Tasks) × 100.
For example, if 68 out of 85 tasks are completed, the rate is 80%.
Why It Matters:
- Tracks workflow efficiency and client engagement.
- Identifies delays caused by unclear instructions or complex processes.
- Helps set realistic deadlines based on client behavior.
How to Improve:
- Simplify forms and requests (e.g., use multi-step forms or progress bars).
- Remove friction like login requirements.
- Use tools like Boast for easy feedback collection or spreadsheets for manual tracking.
Tools and Tips:
- Boast: Simplifies feedback collection with no logins required. Plans start at $9.95/month.
- Manual Tracking: Use spreadsheets or export data from CRMs like HubSpot or Salesforce.
A healthy completion rate is 70% or higher. If yours is below 60%, it may signal bottlenecks that need attention. Focus on removing barriers and streamlining client interactions to boost this metric.
Success Rate vs. Completion Rate
sbb-itb-32f6eb2
How to Calculate Client Completion Rate
How to Calculate Client Completion Rate in 5 Steps
Once you’ve defined this metric and understood its value, here’s a clear guide on how to calculate it accurately.
Client Completion Rate Formula
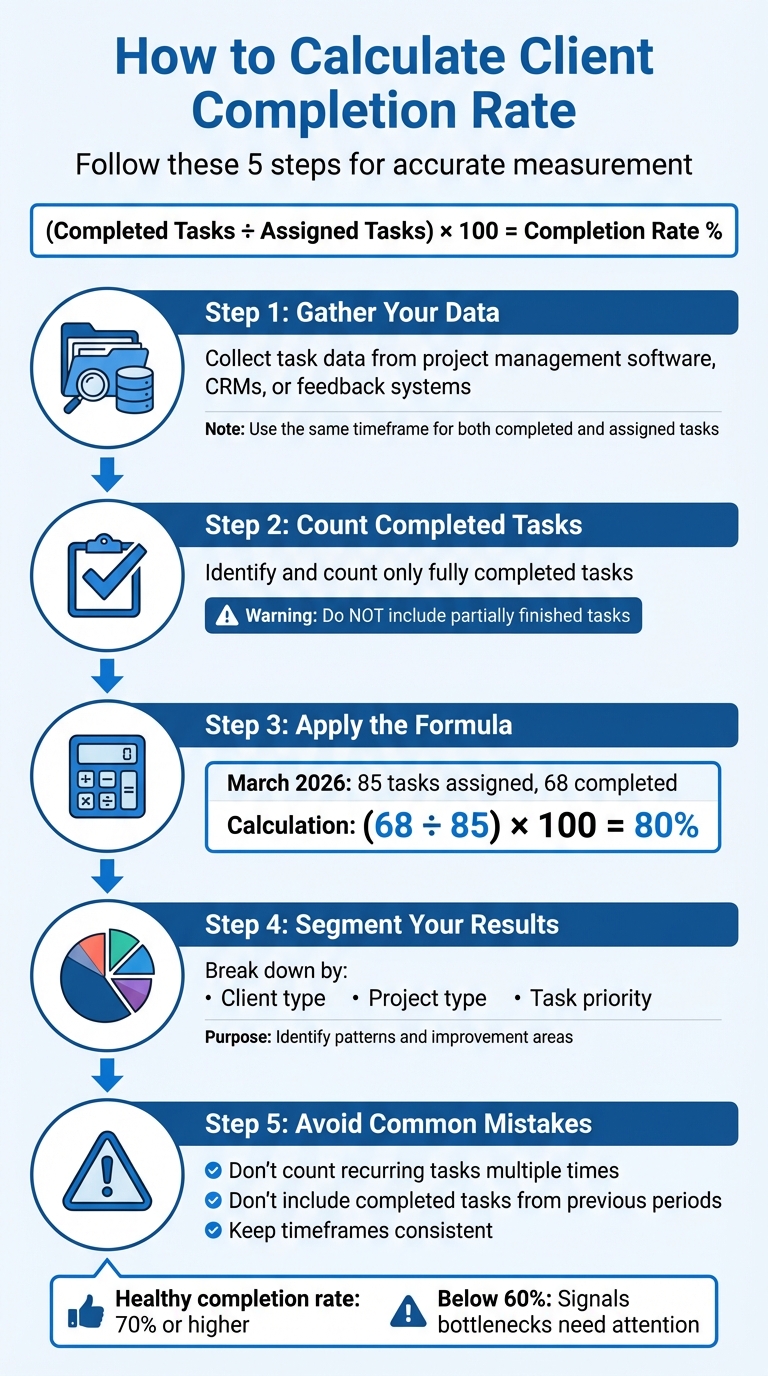
The formula for determining client completion rate is straightforward: (Number of Completed Tasks / Total Number of Assigned Tasks) × 100. This percentage reflects the proportion of tasks that were fully completed.
In this formula:
- The numerator includes only tasks marked as "done", "finished", or "closed" during the specified period.
- The denominator accounts for all tasks assigned within the same timeframe, regardless of their current status.
Here’s how to put this formula into practice.
Step-by-Step Calculation Process
- Step 1: Gather Your Data
Collect task data from tools like project management software, CRMs, or feedback systems. Implementing a structured feedback process can significantly improve the quality of data collected from these systems. Ensure you’re using the same timeframe for both completed and assigned tasks to maintain accuracy. - Step 2: Count Completed Tasks
Identify and count only tasks that are fully completed. Do not include tasks that are partially finished. - Step 3: Apply the Formula
For instance, in March 2026, a marketing agency assigned tasks to 85 clients. Out of these, 68 tasks were completed, 12 were still in progress, and 5 had not been started. Using the formula:
(68 ÷ 85) × 100 = 80%. - Step 4: Segment Your Results
Break down the completion rate by categories such as client type, project type, or task priority. This can help you identify patterns and areas that might need improvement. - Step 5: Avoid Common Mistakes
Be cautious not to count recurring tasks multiple times. Also, avoid including completed tasks from previous periods in your current calculation. Consistency in timeframes is key to obtaining reliable results.
Practical Examples of Client Completion Rate
Example for Agencies
Imagine a digital marketing agency that assigned 100 client tasks in February 2026. These tasks included things like gathering feedback on website designs, securing approvals for social media campaigns, and reviewing content drafts. By the end of the month, 75 tasks were completed, while the remaining ones were either still in progress or untouched.
Using the formula (75 ÷ 100) × 100, the agency achieved a 75% client completion rate. This falls within the usual range for marketing agencies, which typically see rates between 65% and 75%, largely because of the creative and collaborative nature of their work.
Freelancers can take a page from agencies by implementing structured feedback and revision systems to improve their own completion rates.
Example for Freelancers
Now, take the case of a freelance web designer. In March 2026, they sent out 50 feedback requests to clients, asking for input on homepage mockups, color schemes, and navigation layouts. Of those, 40 forms were returned with feedback.
Using the same formula (40 ÷ 50) × 100, the freelancer calculated an 80% client completion rate. This higher rate was likely due to their use of a multi-step feedback process that included clear progress indicators, making it easier for clients to follow through.
Tools to Track and Improve Client Completion Rate
Using Boast for Feedback Collection
One of the biggest challenges in improving client completion rates is reducing friction. When clients are required to create accounts, remember passwords, or navigate complicated dashboards, they often abandon the process. Boast offers a straightforward solution to this problem.
With Boast, clients simply click a link and provide feedback - no login or training needed. This eliminates a major hurdle, especially given that nearly 66% of people who start an online form never finish it. On your end, you still get access to structured task tracking and project management tools, while clients enjoy a hassle-free experience.
Boast also includes built-in analytics to monitor feedback request completion rates, helping you identify where engagement tends to drop off. Pricing starts at $9.95 per month for Solo plans or $19.95 per user per month for Team plans, both of which include unlimited external collaborators.
For those who prefer more control over their data, manual tracking methods can be a viable alternative.
Manual Tracking with Spreadsheets or CRMs
If automated tools like Boast aren't your preference, manual tracking can still get the job done. Create a spreadsheet with columns for key details such as Task Name, Client, Assigned Date, Status (Done/In-Progress), and Completion Date. Alternatively, export data from your CRM (like HubSpot or Salesforce) and calculate completion rates using this formula:
(Number of Completed Tasks ÷ Total Number of Assigned Tasks) × 100.
To ensure accuracy, make sure the timeframe for completed and assigned tasks matches. Establish a regular review schedule: dedicate 15 minutes weekly to update the spreadsheet, 45 minutes monthly to analyze patterns, and 90 minutes quarterly for a deeper strategic review. Without consistent reviews, manually tracked data can quickly become outdated or unreliable.
Interpreting and Improving Client Completion Rate
Benchmarking Healthy Completion Rates
A client completion rate of 70% or higher is generally considered solid, though this can vary depending on the industry and the complexity of the projects. For example, marketing agencies often fall between 65% and 75%, reflecting the creative demands of their work. On the other hand, software and SaaS companies typically achieve rates in the 75% to 85% range.
If your completion rate drops below 60%, it likely means clients are hitting barriers - whether it’s unclear instructions, technical issues, or an overly complex process. On the flip side, rates above 80% often indicate strong client engagement and an efficient workflow. Early-stage companies (0–50 employees) usually see completion rates between 60% and 75%, while larger organizations with 500+ employees often reach 75% to 85%.
These benchmarks provide a useful yardstick for assessing your performance and identifying areas for improvement.
Strategies to Improve Completion Rates
Once you’ve identified where your completion rate stands, you can focus on specific strategies to improve it.
Start by removing any points of friction and handling client feedback without losing context. For example, multi-step forms can increase completion rates by 52.9% compared to single-page forms because they break tasks into smaller, more manageable steps.
Adding progress indicators, like "Step 2 of 4" or a visual progress bar, can also make a big difference. These features give clients a clear sense of how much they’ve completed and how much is left. To make forms even smoother, consider using conditional logic to display only the questions that are relevant to each client. Including brief help text or embedding a short video can further enhance the experience by addressing questions on the spot.
If your process still requires clients to create accounts or remember passwords, you might be losing them early in the journey. Research shows that 92% of users will abandon a task rather than recover a forgotten password. Tools like Boast can eliminate this hurdle by letting clients provide feedback with just a single link - no login required. This small adjustment alone can push your completion rate from 45% to over 70%.
Conclusion
Tracking client completion rates goes beyond just monitoring numbers - it’s about spotting bottlenecks that slow down your projects and addressing them before they escalate into bigger issues. Since many clients abandon forms and multi-step processes have been shown to improve completion, focusing on these areas can lead to better outcomes for your business.
Completion rates directly reflect the health of your workflows and client relationships. High rates mean smoother onboarding, fewer follow-up emails chasing missing details, and quicker project kick-offs - all of which save time and resources while keeping clients happy.
One of the biggest challenges to improving these rates is client friction. Even small hurdles, like requiring unnecessary logins or complicated account setups, can derail progress. Tools like Boast eliminate these obstacles by enabling clients to provide feedback with just a single click - no accounts, no training, no hassle. This highlights the value of prioritizing client convenience to streamline workflows.
Setting actionable thresholds for completion rates turns raw data into meaningful insights. For instance, if your rate drops below 50% for three weeks, it may be time to ramp up marketing efforts. If your rates fall below industry benchmarks, it’s worth reviewing your client-facing processes to simplify them. Features like progress indicators, conditional logic, and visual cues can guide clients through each step more effectively.
Start monitoring your completion rates now, set realistic goals based on industry standards, and focus on eliminating one friction point at a time. Even small tweaks can lead to big improvements over time.
FAQs
What counts as a “completed” task?
A “completed” task is one that has been successfully finished within a specific timeframe. In other words, all necessary criteria or deliverables have been met, signaling that the work is ready for review or handoff.
How do I handle tasks assigned in one month but completed later?
When assigning tasks, record them as "assigned" in the month they’re allocated. Once the task is finished, update its status to "completed", regardless of when it was completed. By keeping assignment and completion dates separate, you can track progress more accurately. This method helps you evaluate performance, pinpoint delays, and maintain a clear picture of task timelines. It’s a simple way to streamline workflow and boost overall productivity.
How often should I review completion rate data?
Reviewing your completion rate data on a regular basis is key to staying on top of client engagement and project progress. Whether you choose to do this weekly or monthly, having a consistent schedule allows you to spot trends, identify bottlenecks, and address any issues before they escalate. This proactive approach not only helps improve project outcomes but also boosts client satisfaction by ensuring their needs are met efficiently.